Price charts tell a story, and chart patterns are one of the clearest ways to read it. In both forex and crypto markets, price tends to move in recognizable formations that repeat over time. These patterns form as traders react to support, resistance, and shifting sentiment.
A breakout from a triangle or a rejection at a double top often signals what may come next. Learning how to spot and use these patterns can help you time entries, manage risk, and avoid random trades.
This guide breaks down how chart patterns work and how to apply them in real trading conditions.

What Are Chart Patterns?
Chart patterns are shapes formed by price movements on a chart. They develop over time as buyers and sellers interact at key levels. Each pattern reflects a shift in control between bulls and bears, which is why traders use them to anticipate possible price direction.
These patterns are not random drawings. They represent behavior. For example, repeated failure to break a resistance level can form a double top, showing that buyers are losing strength. On the other hand, steady higher lows may form a triangle, hinting that pressure is building for a breakout.
In both forex and crypto, chart patterns appear across all timeframes. A pattern on a 5-minute chart may play out quickly, while the same structure on a daily chart can lead to larger moves.
Types of Chart Patterns
Chart patterns generally fall into three categories based on what they suggest about price movement.
Reversal Patterns
These patterns signal that the current trend may be coming to an end.
- Head and Shoulders
- Double Top and Double Bottom
- Triple Top and Bottom
Continuation Patterns
These suggest that the current trend is likely to continue after a pause.
- Flags and Pennants
- Ascending and Descending Triangles
- Rectangles
Bilateral Patterns
These can break in either direction depending on market pressure.
- Symmetrical Triangles
- Expanding formations
How to Identify Chart Patterns
Spotting chart patterns takes practice, but the process becomes clearer once you know what to look for. The goal is to find clean structures rather than forcing shapes onto the chart.
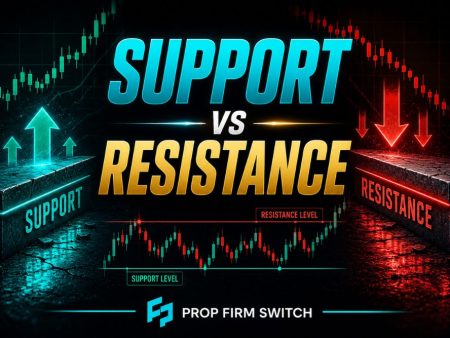
Start by marking key support and resistance levels. These areas often act as boundaries where patterns form. Then watch how price reacts around those zones. Repeated touches or rejections can signal the early stages of a pattern.
Trendlines are another useful tool. Drawing lines across highs or lows can help reveal triangles, channels, or wedges. The cleaner the structure looks, the more reliable it tends to be.
Patience matters here. Jumping in before a pattern fully forms can lead to false signals. Waiting for confirmation often leads to better trade quality.
How to Use Chart Patterns in Trading
Spotting a pattern is only the first step. What matters more is how you turn that pattern into a structured trade. Many traders recognize patterns but still lose money because they enter too early or ignore confirmation.
The goal is to use chart patterns as a guide, not a guarantee. Each setup should have a clear reason for entry, a defined risk level, and a realistic target.
A Simple Way to Trade Chart Patterns
- Identify a clean structure
Focus on patterns that are easy to see. If you have to force it, it’s probably not valid. - Wait for confirmation
Let price break out or reject a level before entering. Entering too early is one of the most common mistakes. - Use volume or momentum as a clue
Strong breakouts often come with higher volume or strong candles. Weak moves can fail quickly. - Plan your stop loss properly
Place your stop outside the pattern. For example, below support in a breakout or above resistance in a reversal. - Set a realistic target
Many patterns have measurable moves. A triangle or flag often moves based on the size of the pattern.
Best Chart Patterns for Forex and Crypto Traders
Some patterns show up more often and tend to be easier to trade, especially for beginners.
1. Head and Shoulders
This is one of the most recognized reversal patterns and usually forms after a strong trend. It has three peaks: a higher middle peak (the head) and two lower peaks on each side (the shoulders). This structure shows that momentum is starting to fade.
Traders watch the “neckline,” which acts as support. Once price breaks below that level, it often signals a shift from an uptrend to a downtrend. The same idea applies in reverse for an inverse head and shoulders pattern, which can signal a move upward.
This pattern works well in both forex and crypto, especially when it forms after an extended move where the market is likely to slow down.
2. Triangle Patterns
Triangles form when price starts to tighten between support and resistance. This usually means the market is building pressure before making a move. You’ll often see this during consolidation phases where buyers and sellers are in balance.
There are different types, like ascending, descending, and symmetrical triangles, but the idea is the same. The tighter the price gets, the more likely a breakout becomes.
Traders wait for price to break out of the triangle before entering. In crypto, these breakouts can be sharp due to higher volatility, while in forex they may be more controlled but still reliable when volume supports the move.
3. Flags and Pennants
Flags and pennants appear during strong trends and act like a short pause before price continues in the same direction. After a strong move, price starts to drift sideways or slightly against the trend, forming a small channel or tight pattern.
This pause is often just the market catching its breath before continuing. Once price breaks out of the pattern, it usually follows the original direction of the trend.
These setups are popular with short-term traders because they offer quick continuation trades. They tend to work best when the initial move is strong and backed by momentum.
Trade Patterns, Not Guesswork
Chart patterns give structure to what can otherwise feel like random price movement. They help you read what the market is doing instead of reacting blindly. Still, no pattern works all the time. Losses are part of the process, even with the best setups.
What makes the difference is how you use them. Sticking to clean patterns, waiting for confirmation, and managing risk properly can turn chart patterns into a reliable tool. Over time, patterns become easier to spot, and decisions feel less rushed. Keep it simple, stay patient, and focus on quality setups rather than constant trading.