Price does not always tell the full story. There are times when an asset continues making new highs or new lows while the momentum behind the move begins to weaken. This difference between price action and momentum is known as divergence, and many traders use it to identify potential trend reversals or continuations.
Divergence is one of the most widely used concepts in technical analysis because it helps reveal changes in buying and selling pressure before they become obvious on a price chart. It is commonly applied across stocks, futures, forex, and cryptocurrency markets using indicators such as the Relative Strength Index (RSI) and Moving Average Convergence Divergence (MACD).
Although divergence can provide valuable insight, it should not be viewed as a guaranteed trading signal. Instead, it works best when combined with price action, market structure, and other technical tools.
In this guide, you’ll learn what divergence is, the different types traders watch for, and how it can be used as part of a broader trading strategy.

What Is Divergence in Trading?
Divergence occurs when the price of an asset moves in one direction while a technical indicator moves in the opposite direction. This difference suggests that market momentum may be changing, even if the current price trend is still intact.
For example, a market may continue making higher highs while an indicator such as the RSI forms lower highs. This indicates that buying momentum is weakening, even though prices are still rising. Likewise, prices may continue making lower lows while an indicator forms higher lows, suggesting that selling pressure is beginning to fade.
Divergence is based on the idea that momentum often changes before price does. As a result, many traders use divergence as an early warning sign that a trend could be slowing, reversing, or preparing for a continuation after a pullback.
However, divergence is not a prediction. Markets can continue trending for extended periods despite weakening momentum. This is why experienced traders typically combine divergence with support and resistance levels, candlestick patterns, volume analysis, and overall market structure before making a trading decision.
When used correctly, divergence can provide additional context that helps traders better understand what is happening beneath the surface of a price chart.
Types of Divergence
Divergence can signal either a potential trend reversal or a continuation of the existing trend. Understanding the differences between each type helps traders interpret momentum more effectively and avoid confusing one setup with another.
Here are the four most common types of divergence.
1. Bullish Divergence
Bullish divergence occurs when price forms lower lows while a momentum indicator forms higher lows.
This pattern suggests that although sellers continue pushing prices lower, the strength of the selling pressure is beginning to weaken. As momentum fades, buyers may gradually regain control, increasing the possibility of a bullish reversal.
Bullish divergence is commonly observed after prolonged downtrends and often attracts attention when it forms near major support levels. Traders frequently use indicators such as the RSI or MACD to confirm the divergence before looking for additional bullish confirmation through candlestick patterns or trendline breaks.
While bullish divergence can signal improving momentum, confirmation remains important because markets can continue declining before a reversal develops.
2. Bearish Divergence
Bearish divergence occurs when the price records higher highs while a momentum indicator forms lower highs.
This pattern indicates that buying pressure is weakening even though prices continue moving upward. It may suggest that the existing uptrend is losing strength and becoming more vulnerable to a correction or reversal.
Bearish divergence often appears after extended rallies where momentum begins slowing despite continued price gains. Traders commonly monitor this setup near resistance levels or after significant upward moves.
Rather than entering immediately, many traders wait for additional confirmation such as a bearish candlestick pattern, declining volume, or a break below short-term support before considering a trade.
3. Hidden Bullish Divergence
Hidden bullish divergence occurs when the price forms higher lows while a momentum indicator forms lower lows.
Unlike regular bullish divergence, this pattern is generally viewed as a continuation signal rather than a reversal signal. It suggests that buyers remain in control despite temporary weakness in momentum.
Hidden bullish divergence often develops during pullbacks within an established uptrend. After a short correction, buyers may step back into the market and continue pushing prices higher.
Trend-following traders frequently watch for this type of divergence because it can provide opportunities to enter an existing uptrend at more favorable prices.
4. Hidden Bearish Divergence
Hidden bearish divergence occurs when the price forms lower highs while a momentum indicator forms higher highs.
This pattern typically appears during temporary rallies within a broader downtrend and suggests that sellers remain in control despite improving short-term momentum.
Rather than signaling a reversal, hidden bearish divergence often indicates that the larger downward trend may continue after the pullback ends.
Many traders combine this setup with resistance levels, moving averages, or trendline analysis to identify potential continuation opportunities while trading in the direction of the prevailing trend.
Indicators Commonly Used to Spot Divergence
The table below highlights some of the most widely used indicators for identifying divergence and how traders apply them.
| Indicator | What It Measures | Why Traders Use It |
| Relative Strength Index (RSI) | Measures price momentum on a scale from 0 to 100 | Helps identify weakening momentum and potential bullish or bearish divergence near overbought or oversold levels |
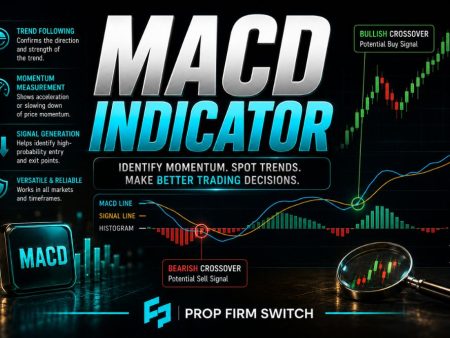
| Moving Average Convergence Divergence (MACD) | Measures the relationship between two moving averages | Commonly used to detect changes in trend momentum and confirm divergence during potential reversals |
| Stochastic Oscillator | Compares the closing price to its recent trading range | Highlights momentum shifts and possible exhaustion after strong price moves |
| Commodity Channel Index (CCI) | Measures how far price deviates from its statistical average | Helps identify momentum extremes that may lead to reversals or trend continuation |
| On-Balance Volume (OBV) | Tracks cumulative buying and selling volume | Confirms whether trading volume supports or contradicts the current price trend |
| Awesome Oscillator (AO) | Measures market momentum using moving averages | Used by some traders to identify changes in momentum before price reverses |
| Money Flow Index (MFI) | Combines price movement with trading volume | Detects buying and selling pressure while incorporating volume into momentum analysis |
Common Mistakes When Trading Divergence
Divergence can provide valuable market insight, but using it incorrectly often leads to poor entries and unnecessary losses. Understanding these common mistakes can help traders apply divergence more effectively.
1. Trading Divergence Too Early
One of the biggest mistakes is assuming that divergence means an immediate reversal.
Momentum can weaken long before price changes direction. In strong trends, divergence may remain visible for several trading sessions while prices continue making new highs or lows.
Waiting for confirmation through price action or market structure can help reduce premature entries.
2. Ignoring the Overall Trend
Counter-trend divergence signals are generally less reliable when markets are experiencing strong directional momentum.
For example, bearish divergence may appear several times during a powerful bull market before any meaningful correction occurs. Likewise, bullish divergence can develop repeatedly during strong downtrends without producing a sustained recovery.
Many traders improve their results by considering the broader trend before acting on divergence signals.
3. Using Divergence Alone
Divergence should be viewed as one piece of market analysis rather than a complete trading strategy.
Professional traders often combine divergence with support and resistance levels, candlestick patterns, moving averages, volume analysis, and trendlines to improve trade selection.
Multiple forms of confirmation generally provide stronger evidence than relying on divergence by itself.
4. Expecting Every Divergence to Produce a Reversal
Not every divergence leads to a major trend change.
Sometimes the market simply pauses, consolidates, or experiences a small pullback before continuing in the original direction. This is particularly common during strong bull or bear markets where momentum temporarily slows without reversing.
Managing expectations can help traders avoid forcing trades based on weak signals.
5. Ignoring Risk Management
Even high-quality divergence setups can fail.
Unexpected economic news, geopolitical events, or shifts in market sentiment can quickly invalidate technical signals. For this reason, experienced traders continue to use stop losses, position sizing, and predefined risk limits regardless of how strong a divergence setup appears.
Proper risk management remains one of the most important factors in long-term trading success.
Divergence Is a Clue, Not a Confirmation
Divergence is a valuable technical analysis concept because it highlights changes in market momentum that may not be obvious from price action alone. By comparing price movement with momentum indicators, traders can identify situations where buying or selling pressure is beginning to weaken.
However, divergence should not be treated as a standalone trading signal. Markets can continue trending despite weakening momentum, and many divergence setups fail without additional confirmation. Combining divergence with support and resistance, candlestick patterns, volume, and trend analysis often provides a more complete view of market conditions.
Rather than predicting the future, divergence offers another layer of information that can help traders make more informed decisions while maintaining disciplined risk management and a consistent trading plan.